
Tax the Rich and Save the World
A movement to reshape the structure of taxation in the U.S. is gaining steam.
Regional Disparities in American Politics and Economics
For decades after the New Deal of the 1930s, the different states and regions of the United States grew together. As different regions--North and South, East and West--became more alike in their economies, they also came to resemble each other more in their politics and social attitudes. The Civil Rights revolution, of course, contributed to this by ending the South's peculiar system of de jure segregation. Also important in spreading economic development throughout the United States, however, were New Deal programs, including welfare spending, progressive taxation, and programs to promote development in rural and mountain areas. (These include the placing of military bases in southern and western states.)

During the post-World War II era, the New Deal continued to shape federal programs, raising income in poorer states, in rural regions, the South, and in the mountain West, and equalizing living standards throughout the United States. Beginning in the late 1970s, however, cutbacks in government social spending, changes in tax policy, and deregulation, including the opening of markets to foreign competition, reversed the narrowing of regional disparities. In recent decades, while goods-producing interior regions including southern states have suffered from foreign competition in manufacturing and other areas, richer coastal regions have benefited from deregulation, stronger protection of intellectual property, and the expansion of foreign trade in entertainment and in financial and business services. These economic changes have contributed to a political upheaval where industrial regions in the South and Midwest have abandoned their traditional loyalty to the Democratic Party even while Democrats have gained in prosperous, export-oriented coastal regions.
Regional growth disparities have increased. (See Figure 1.) Starting in the 1970s, a larger share of economic growth began to go to export-oriented economies on the coasts and in the farm belt, less to other rural areas in the South and West and to the industrial Midwest. Before 2000, income generally grew faster in the poorer regions of the South than in the coastal regions. But since 2000, coastal entertainment, high tech, and financial centers like Los Angeles, New York, and San Francisco have boomed while income growth in the South has slowed and the industrial Midwest and the mountain West continued to lag. Between 1963 and 2000, per capita income differentials narrowed. In 1963, for example, per capita income in coastal states was 48% above that of the Deep South and the differential fell to 34% by 2000. By 2016, however, the gap had grown to 55% and per capita income in the coastal states rose to 28% above the industrial Midwest in 2016, up from -3% in 1963, to 46% relative to the Border South states, up from 33% in 2000, and up to 33% relative to the Mountain states in 2016 compared to 15% in 2000. Only the export-oriented farm belt increased its relative income compared with the coastal states.
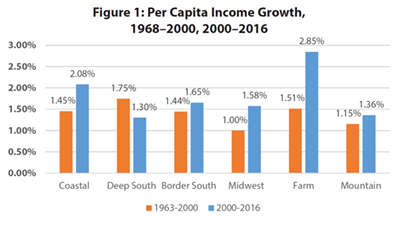
Sources: Spreadsheet "State exports" Tab "State GDP 1999-2016". Percapita income (PCY) from state GDP (from Bureau of Economic Analysis) divided by population (from the Census). The change in PCY is the 2016 level divided by the relative price increase 1978-2016, total divided by the 1978 level. The price level is from the BLS in tab CPI in the "State exports" spreadsheet. Annual change is the log of the change divided by the number of years.
Wall Street favors the urban coasts. (See Figure 2.) Economic policies favoring Wall Street (as well as entertainment and other professional employments) over Main Street favor residents of coastal states over the nation's interior. Different regions have been affected differently by economic policies favoring the export of financial and professional services in exchange for imports of manufacturing goods. Regions with goods-producing industry, like manufacturing, have suffered from import competition, while the affluent coastal regions with fewer workers in manufacturing and mining, have benefited from the export of financial and business services, and maintained employment-producing and hard-to-import services such as education, entertainment, and health care.
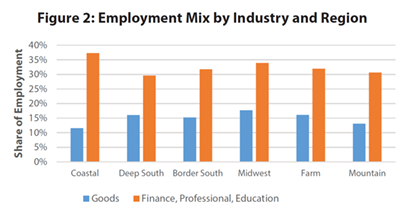
Sources: Total Employment and employment by industry in 2016 is from the Bureau of Labor Statistics, ESTABLISHMENT DATA, STATE EMPLOYMENT, SEASONALLY ADJUSTED, Table D1. Data are in spreadsheet "State Exports" tab "Employment Mix"
Economic policies since the early 1970s have accelerated the decline of American unions. (See Figure 3.) While the share of workers belonging to unions has declined in every state, the greatest absolute decline has been in the industrial Midwest, where the share of workers belonging to unions has fallen by nearly 14 percentage points, and the Deep South, where the union membership share has fallen by nearly seven percentage points or 60%. By contrast, unions have fared better in the affluent coastal regions where total membership has been sustained by the growth of public-sector unions. Indeed, the coastal states are now the most unionized part of the United States. While national policies of free trade and industrial deregulation, and the hostility of economic and political elites to public-sector organization, have decimated unions throughout the rest of the United States, unions, especially public-sector unions, have fared better in affluent coastal states than elsewhere.
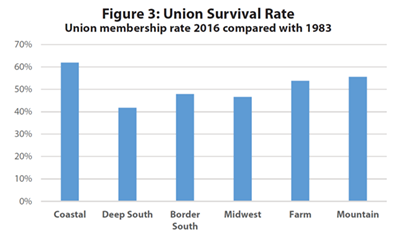
Sources: Union decline uses data from Union Stats. It is in spreadsheet "State exports" Tab "2017".
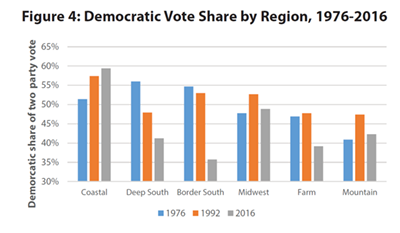
Regional economics affects politics. (See Figure 4.)Through the 1980s, the Democratic Party represented poorer parts of the country and campaigned for broad-based economic growth with industrial policy, business regulations, and income redistribution. Since the economic turmoil of the 1970s, however, and with the Democrats' embrace of the Civil Rights movement and the Republicans' embrace of Nixon's "Southern Strategy," the two parties have shifted. The Democrats now represent the more prosperous and cosmopolitan regions while Republicans represent the regions left behind by economic growth. The new (and influential) affluent component of the Democrats' base has pulled them away from policies to promote shared regional growth, such as support for managed trade or industrial policy, even while Republicans remain tied to neoliberal policies of fiscal austerity and industrial deregulation that hurt many of their own supporters. While the Democrats continue to support elements of the social safety net, such as Social Security, their support for income redistribution has been softened, as when Democrat Bill Clinton supported repeal of the Aid to Families with Dependent Children.
Spreadsheet "State Exports" Tab "Elections". Results for 1976 and 1992 are from U.S. Election Atlas. Results for 2016 are from the New York Times