
When All Else Is Out of Bounds, Zap Labor
From Nixon’s wage controls to today’s interest rate hikes, the fight against inflation has targeted labor.
Copper, the first metal worked by humans, will be crucial to decarbonization, and could be the path to a Chinese Century.

Copper was the first metal worked by homo sapiens—and was the basis of the Bronze Age, a period that lasted more than a millennium. Bronze metallurgy shifted the balance of power between empires and provided tools to increase agricultural output to those empires with the ability to meld copper and tin.
Today, copper is the critical element for decarbonization.
Once again, leadership, in this case in copper mining and processing, will reshape the global balance of power and reorganize the global political economy. Copper mining and processing involves multiple countries and companies, but China has emerged as the dominant producer of refined copper. And China’s copper output is directed to the sectors that are drivers of decarbonization.
Consider two major economic sectors: transportation and power generation.
The transportation sector generates about 20% of global greenhouse gas emissions. Decarbonization requires a shift from fossil fuel vehicles to electric vehicles. This shift will dramatically increase the need for copper in vehicle manufacturing. Electric vehicles use copper in batteries, rotors, charging infrastructure, and more. On average, manufacturing a fossil fuel vehicle requires 23 kilograms of copper. Manufacturing an electric vehicle requires 60 kilograms of copper for a plug-in hybrid and 83 kilograms for a battery-powered electric vehicle.
Industry and electricity generation account for almost 40% of greenhouse gas emissions globally. Decarbonization means a move away from coal and other fossil fuels for power generation, replaced by solar and wind in addition to the established share of power already generated by hydropower. Copper is also a key component for constructing solar panels and wind turbines.
Solar photovoltaic cells (the electricity-producing units that are used to create solar panels) require almost 2,900 kilograms of copper for each megawatt of generating capacity. Wind turbines need 8,000 kilograms of copper per megawatt of generating capacity for offshore and 2,900 kilograms of copper for onshore installations. (The majority of utility-scale solar panel installations in the United States generate five megawatts or less, and one wind turbine can generate between two and 15 megawatts, depending on its location. One megawatt of solar capacity produces enough electricity over a year for about 200 average U.S. homes, while one megawatt of wind capacity can power more than 250 homes.)
In this energy transition, copper replaces the role of petroleum. Like the latter, copper does not itself create the new energy infrastructure, but, like petroleum, copper makes the new processes of energy generation possible.
In short, without copper, there are no solar panels; without copper, there are no wind farms; without copper, there are no electric vehicles. Without copper, your cell phone would be less compact. And copper is crucial to the much lengthier and larger grid that this energy transition requires.
So, how much copper do we need to carry out the decarbonization revolution?
A good working estimate is that we must produce as much copper in the next quarter century as humanity has done in all millennia to date.
So, two questions: Where is copper produced, processed, and refined around the world? And how does copper move through the global economy, and where is it ultimately used?
The global copper industry is dominated by 13 mines, which are located in four countries, and are majority-owned by just six multinational mining companies.
Copper is distributed widely across the globe but constitutes only 0.006% of the earth’s crust—making it much less common than aluminum (at 0.8%) and iron (at 0.56%). Each of the 13 mines has an ore content between 1% and 1.5%, a concentration of copper ore that is between 100 and 200 times the average found in the Earth’s crust. But even this relative abundance of copper requires moving about 100 tons of material to produce one ton of copper. Copper mining moves more earth than any other human activity. The biggest open-pit mine, Bingham Canyon in Utah, which supplied one-third of all of the copper used by the allies in World War II, can be discerned by astronauts on the moon.
In the 19th century, on the cusp of electrification, copper mining was an almost artisanal activity: mines with an ore content of 20% or more globally produced less than one million metric tons per year (global copper mine production in 2025 is estimated at about 23.5 million metric tons). Two people in the United States, Carrie Everson and Daniel Jackling, transformed copper production. In the 1800s, Everson developed the froth flotation process, which became central to separating copper ore from the huge amount of non-ore-bearing material. Then, in the early 1900s, Jackling industrialized copper mining, applying explosives and huge earth-moving machinery. Copper could now be profitably mined from mineral deposits containing just 1% to 2% copper.
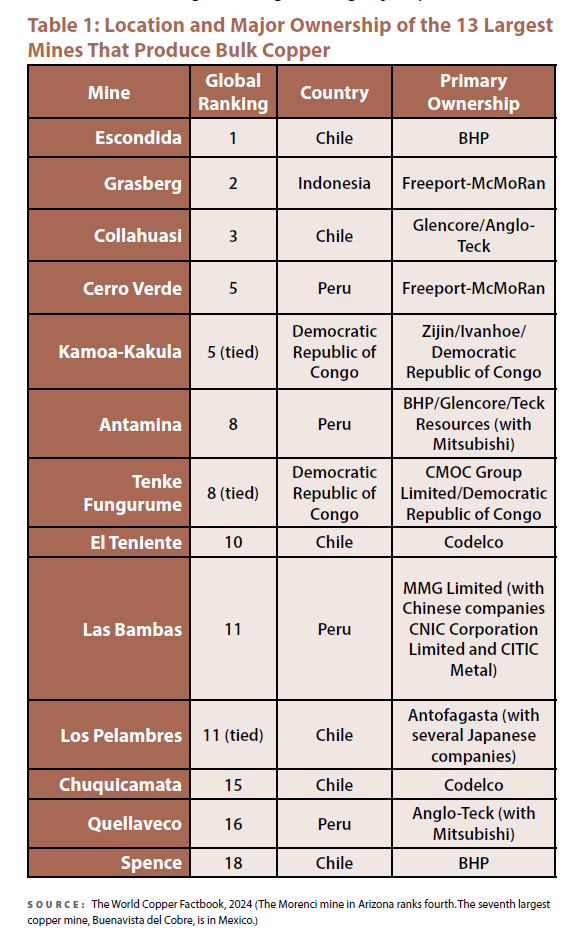
Table 1 combines data on the top 13 mines’ output ranking, location, and company ownership. In several cases, mines are joint ventures among the largest producers. For example, the Collahuasi mine in Chile is jointly owned by Glencore and Anglo-Teck; and the Tenke Fungurume mine in the Democratic Republic of Congo is owned by CMOC Group Limited in partnership with the country’s government.
Copper ore is found in many countries, but the 13 mines that provide the bulk of copper globally come from just four countries: Chile, Peru, the Democratic Republic of Congo, and Indonesia. Chile has long been the largest source of copper, producing about 25% of all copper mined globally. Six of the 13 largest copper mines are in Chile, including the first and third largest. Another four are in neighboring Peru.
The Grasberg mine in Indonesia, which is the second largest in the world, is a relatively new major copper producer, having begun production in the 1980s. The mine is also one of the world’s top three gold mines. The Democratic Republic of Congo’s rise into the top four copper producers is a relatively recent development, having surpassed Peru for second place in 2023.
Ownership of these 13 mines is largely in the hands of multinational mining companies headquartered thousands of miles away from
the mines. Five of the copper mining companies that organize the process of copper production are among the largest mining companies by revenue and profits in the world: BHP (Australia), Glencore (Switzerland), Freeport-McMoRan (United States), Zijin (China), and Anglo-Teck (Canada).
The sixth company, Codelco, is the state-owned copper producer in Chile and the culmination of a decades-long struggle by Chileans to take control of what they consider to be their national patrimony. Copper was fully nationalized under socialist President Salvador Allende in 1971.
With the exception of Codelco, all of these companies are geographically diversified, owning mines and often refineries in more than a single country.
Copper is traded globally across long distances because the major processors and consumers of copper are often several thousand miles from the largest mines. The global copper trade is among the top 10 commodities by value.
There are two primary forms in which copper is traded. The first is ores and concentrates—the product of grinding, crushing, and froth flotation that produces a “matte,” a partially refined metal containing 20–40% copper. Exports in these forms are 25% and 31%, respectively, of total exports from Chile and Peru. Copper ores and concentrates are among the top 5% of globally traded goods by value.
Like over 80% of globally traded goods, copper ores and concentrates are shipped by boat. And these boat journeys are long. As depicted in the diagram below, China is the major destination for copper ores and concentrates shipped from Chile and Peru. The nautical distance from the port city of Valparaíso in Chile to Shanghai International Port in China is nearly 12,500 miles. Shipping ores and concentrates from Peru to China is a similar distance.
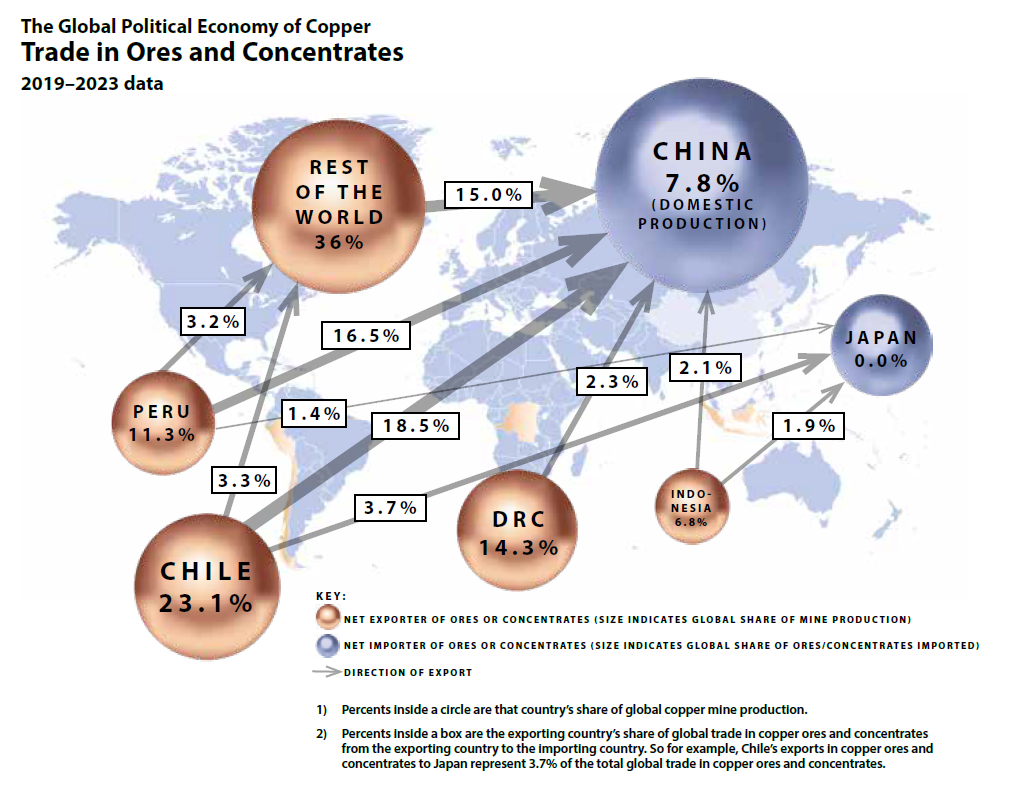
The diagram of ore and concentrate trade flows is only two dimensional, like many descriptions of global trade. This obscures as much as it reveals. To be useful for industrial production, copper has to be mined, crushed, and then smelted and refined. The most significant value-added stage is the smelting and refining process. Production of ores and concentrates is a low-value-added stage of the copper value chain when compared to the production of refined or manufactured copper products. When understood in this context, the global political economy of copper (and many other commodities) is not the mutually beneficial exchange of one good for another in the Ricardian fantasy of trading Portuguese wine for British cloth. It is a processing hierarchy in which the high-value operations are located and controlled thousands of miles away from the low-value extracting process.
Copper outputs from Peru and Indonesia leave these countries in the form of ores and concentrates for refining in China and, to a lesser extent, in Japan.
China ranks fifth globally by mine output, but its domestic production is substantially short of the amount needed to supply the country’s refineries. As a result, China has become the largest importer of copper ores and concentrates and is the leading global producer of refined copper, accounting for more than 40% of the global output. In the post-2000 decades, China refurbished, expanded, and upgraded its smelting and refining industry, improving pollution controls and achieving the same environmental standards seen in Europe.
Copper is also traded in its refined form. For example, all the copper imported into the United States is refined and comes primarily from the Chilean state-owned mining company Codelco. Global trade in refined copper is also in the top 5% of traded goods by value.
As the second diagram makes clear, China is also at the center of the global trade in refined copper.
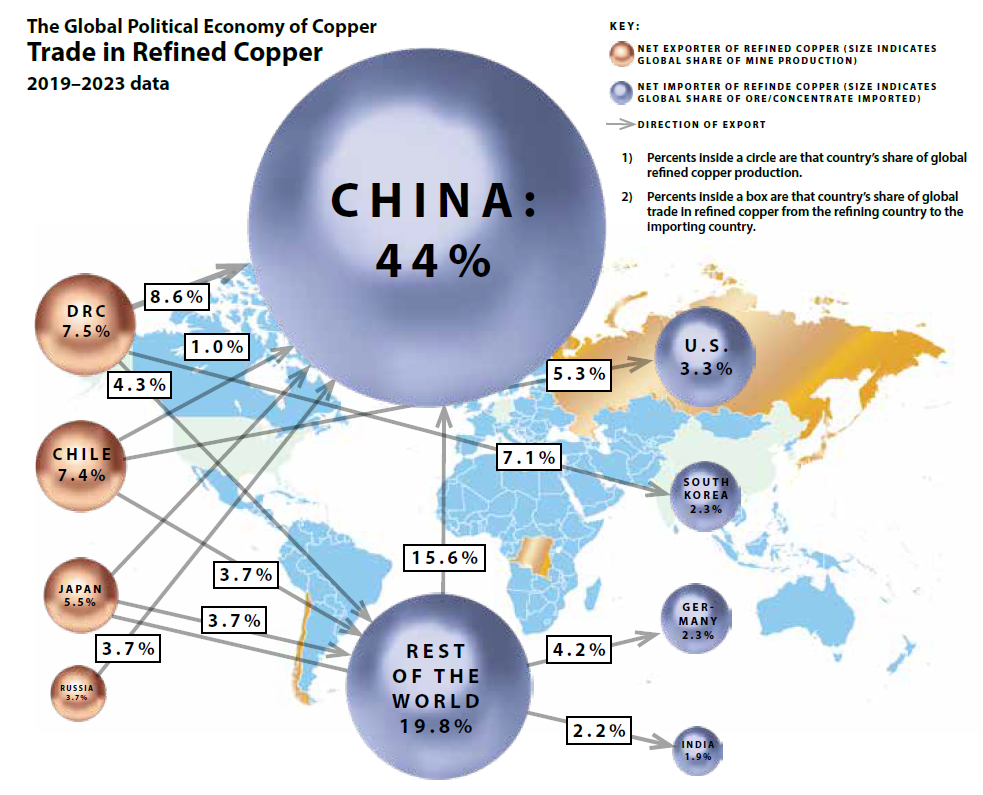
The pattern of global trade in refined copper is significantly different than that of global trade in copper ores and concentrates. Remarkably, despite having no domestic copper mines, Japan is the fourth largest producer and the third largest exporter of refined copper.
The Democratic Republic of Congo provides an interesting case study. The copper from the largely Chinese-owned mines (owned primarily by Zijin) is smelted and refined domestically. The refined copper exports then move to China through the Port of Dar es Salaam (Tanzania) and Port of Beira (Mozambique).
China’s involvement in the Democratic Republic of Congo dates back to the construction of the Tanzania-Zambia railroad in the 1970s. In 2008, the Democratic Republic of Congo executed an agreement with Chinese mining companies to grant access to both copper and cobalt mines. Freeport-McMoRan sold its properties in the Democratic Republic of Congo to Chinese mining companies in 2016.
China is at the center of the global trade in copper. What exactly is the country doing, or planning to do, with all that copper?
First, it is worth emphasizing that electrification is an ongoing process in China. The rapid industrialization from the 1990s forward required a huge expansion in electricity generation and the building out of a grid across a territory that is only slightly smaller than the United States. China increased its copper imports and its ability to process and refine ores and concentrates dramatically after 2000.
But the larger context for China’s decision to move forward, even to lead, the transition to renewable energy involves not only domestic considerations—such as economic growth, energy needs, and government policy—but also China’s place within the global political economy.
China has very limited petroleum reserves and has been the largest importer of crude oil for more than a decade, making the country dependent on other countries for energy. China has extensively mined its large reserves of coal, and production has quadrupled in the last 25 years. Today, China mines over half of the global total. However, the use of coal has generated significant political opposition because of pollution: China is globally the largest source of greenhouse gases (although not on a per capita basis) and the central government has both promoted and responded to pressures to replace coal with renewable sources of energy.
But there is also a larger context to China’s drive toward renewables: global positioning. I think—and yes, this is speculation on my part—that China’s leadership sees the green energy transition as a path to displace the United States from its position in the global hierarchy of economic and political leadership.
To better understand China’s decision to replace fossil-fuel energy with renewables, we need to look at the importance of that trajectory for copper, and the implications for the global political economy. China produces about 30 million cars annually and over half of them are electric vehicles—either battery powered or plug-in hybrids—accounting for almost 60% of electric vehicle production worldwide. China is also driving the global shift to electric vehicles via exports and foreign investment. China accounts for 40% of all electric vehicle exports. The largest Chinese auto manufacturer is BYD. The company has opened its fourth plant in Brazil, on the site of a former Ford auto plant. BYD plans to produce 200,000 electric vehicles and plug-in hybrids annually. Brazil, along with the rest of Latin America, has a low density of auto ownership compared to the United States and Europe. Chinese auto manufacturers’ aggressive move into the region will establish electric vehicles rather than fossil fuel vehicles as the car of choice. An increased demand for copper will necessarily follow. And, recently, Canada has agreed to a lower tariff on a limited number of Chinese electric vehicle imports.
In 2024, China added 277,000 megawatts of solar power to its grid. In that same year, China also added 80,000 megawatts of wind power. And the growth of renewable power generation in China is accelerating. On the Tibetan Plateau, China is completing a huge solar buildout that will generate an additional 20,000 megawatts of power.
Again, the energy shift is not simply domestic. Solar photovoltaic cells are the core manufactured output for producing solar power worldwide. China is the leading producer and exporter of solar panels, shipping half of the global total. In Africa, demand for Chinese solar panels has jumped over 60% in the last year, with a focus on household installations, freeing residents from the ongoing problem of grid blackouts and lack of electricity infrastructure.
China’s exports in transportation and power generation create an infrastructure of sunk capital investment (money and resources that have already been spent and cannot be recovered) that gives the country a dominant position in the developing regions of the world that will be difficult for others to displace. That is especially true if a potential rival country such as the United States makes the choice not to compete in the drive toward a new green energy regime.
Today, copper is poised to shape the destiny of our species, just as it did in the Bronze Age.
In 1941, Henry Luce, owner and publisher of Time magazine, wrote an article entitled “The American Century.” He called for the United States to use its power to shape and lead the international system. The energy regime underwriting that power was that of fossil fuels, in transportation, industry, and power generation. The suite of institutions that emerged from World War II—the World Bank, the International Monetary Fund, and the Bretton Woods currency system—shaped the world for the next seven decades.
If we are on the verge of a new energy regime, are we also at the end of the American Century? What would come next? Is there such a thing as the Chinese Century? Or will the energy transition create a multipolar world, one in which China, because of its leadership in the new energy regime, will occupy a central—or perhaps leading—role?
Sources: IDTechEx, “The Electric Vehicle Market and Copper Demand,” International Copper Alliance, June 2017 (internationalcopper.org); Philip F. Notarianni, “Copper Mining, the King of the Oquirrh Mountains,” History to Go (historytogo.utah.gov); OEC, “Copper Ores and Concentrates” (oec.world); International Copper Study Group, “World Refined Copper Production and Usage Trends,” ICSG Copper Bulletin, May 2026 (icsg.org); Farrell Gregory and Paul J. Milas, “China in the Democratic Republic of the Congo: A New Dynamic in Critical Mineral Procurement,” Strategic Studies Institute at the U.S. Army War College, October 17, 2024 (ssi.armywarcollege.edu); International Copper Association, “Infrastructure Reimagined Fact Sheet: Industry and the Power Grid,” February 2022 (internationalcopper.org); Jennifer L, “Two Solar Stories, Two Different Directions: Why China Builds Faster as the U.S. Hits Pause,” CarbonCredits.com, October 21, 2025 (carboncredits.com); GlobalData, “Global copper output to grow modestly in 2025, amid supply challenges in Australia and Indonesia,” Mining Technology, October 14, 2025 (mining-technology.com); U.S. Energy Information Administration, “Most U.S. utility-scale solar photovoltaic power plants are 5 megawatts or smaller,” February 7, 2019 (eia.gov); U.S. Department of Energy, “Wind Turbines: the Bigger, the Better,” August 21, 2024 (energy.gov); U.S. Energy Information Administration, “Wind explained: Types of wind turbines,” December 27, 2023 (eia.gov); Dawn Bunyak, “To Float or Sink: A Brief History of Flotation Milling,” 2000, Mining History Journal (mininghistoryassociation.org); Richard W. Sadler, “Jackling, Daniel Cowan,” Utah History Encyclopedia (uen.org/utah_history_encyclopedia); OEC, “Refined Copper in Japan” (oec.world); U.S. Energy Information Administration, “China surpassed the United States as the world’s largest crude oil importer in 2017,” December 31, 2018 (eia.gov).