
This article is from Dollars & Sense: Real World Economics, available at http://www.dollarsandsense.org
This article is from the July/August 2014 issue.
Subscribe Now
at a 30% discount.
Economy in Numbers
What Happened to the Recovery?
Part I: Weak Employment, Stagnant Wages, and Booming Profits
The 2007-2010 recession was the longest and deepest since World War II. The subsequent recovery has been the weakest in the postwar period. While total employment has finally returned to its pre-recession level, millions remain out of work and annual output (GDP) is almost a trillion dollars below the economy’s “full-employment” capacity. This column explains how high levels of unemployment have held down wages, contributing to soaring corporate profits and a remarkable run-up in the stock market.
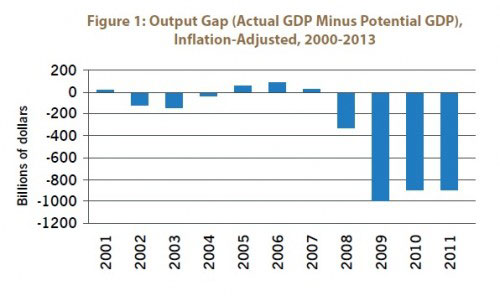
Output plunged and has not recovered. There was a sharp fall in output (GDP) at the onset of the Great Recession, down to 8% below what the economy could produce if labor and other resources were employed at normal levels (“full employment” capacity). Since the recovery began, output has grown at barely above the rate of growth in capacity, leaving the “output gap” at more than 6% of the economy’s potential—or nearly $1 trillion per year.
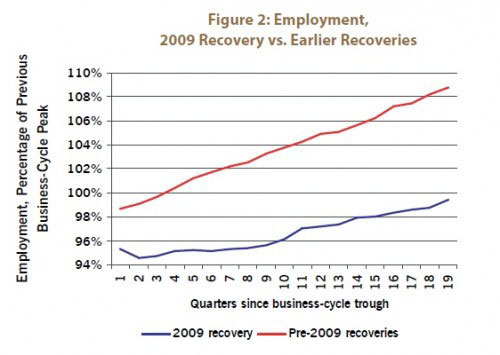
The drop in employment was much worse than in previous recessions. With eight million jobs lost, employment fell more sharply going into the Great Recession than it did in previous recessions. It took five years for the economy to recapture its pre-recession level of employment, a rate of recovery much slower than for previous post-World War II recessions. Had employment recovered at the average pace for pre-1991 recoveries, there would be more than 11 million additional jobs today.
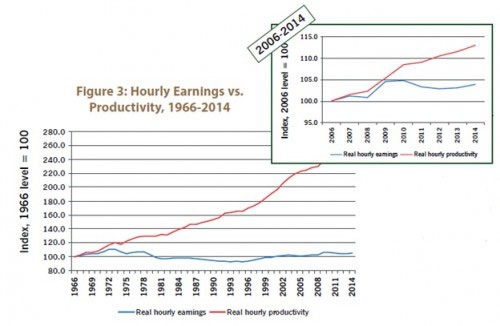
Productivity is growing; wages are not. The gap between rising productivity and stagnant wages—growing since the 1970s—has increased with the Great Recession. Real output per hour has continued to increase during the recession and recovery. Wages, however, have remained stuck at a level lower than in the early 1970s.
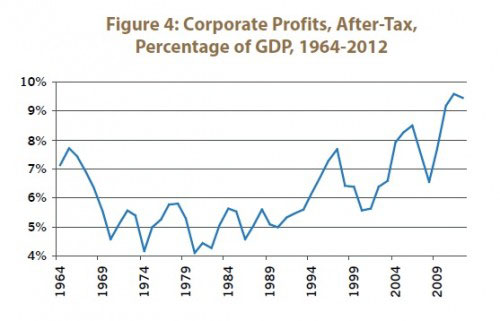
Corporate profits are soaring. While output, employment, and wages have remained depressed, after-tax corporate profits have soared to about one-tenth of national income. While this continues a trend that goes back to the 1970s, the rising profit rate since the Great Recession reflects how high levels of unemployment allow employers to push employees to work harder and produce more—even without paying higher wages.
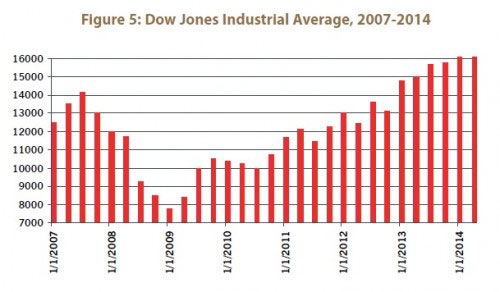
The stock market has surged. The combination of low interest rates (which keep down corporate borrowing costs and make bonds less attractive than stocks) and rising corporate profits has produced a surge in the stock market. Despite the weak recovery, the Dow Jones Industrial Average is now well past its pre-recession peak.
Part II: Government Policy and Why the Recovery Has Been So Slow
The recovery from the Great Recession has been so slow because government policy has not addressed the underlying problem: the weakness of demand that restrained growth before the recession and that ultimately brought on a crisis. Focused on the dramatic events of fall 2008, including the collapse of Lehman Brothers, policymakers approached the Great Recession as a financial crisis and sought to minimize the effects of the meltdown on the real economy, mainly by providing liquidity to the banking sector. While monetary policy has focused on protecting the financial system, including protecting financial firms from the consequences of their own actions, government has done less to address the real causes of economic malaise: declining domestic investment and the lack of effective demand. Monetary policy has been unable to spark recovery because low interest rates have not been enough to encourage businesses and consumers to invest. Instead, we need a much more robust fiscal policy to stimulate a stronger recovery.
The Fed has kept interest rates unprecedentedly low. Determined not to repeat what orthodox economists saw as the main cause of the Great Depression—a “tight” money supply—the Federal Reserve responded very aggressively to the crisis in 2007 and 2008. The Fed drove its main target short-term interest rate, the federal funds rate, down to an unprecedented near-zero level. Even at interest rates below zero in real (inflation-adjusted) terms, however, effective demand has been so depressed and so much unused productive capacity has remained that banks have found few borrowers.
Corporate bond rates have continued to drift upward. The Federal Reserve tries to encourage economic expansion and job creation by driving down the interest rate on Treasury bills in order to indirectly force down the interest rates corporations pay on their borrowing. This policy has become less effective over time because investors have been insisting on a larger risk premium for lending to corporations. Since the 1970s, the rate on corporate bonds has been drifting up relative to treasury rates: Interest rates on corporate bonds have risen an average of 50 basis points (0.5 percentage points) each decade, relative to Treasury bills.
Monetary policy has not spurred investment; banks have stockpiled cash. The lack of demand for borrowing, and banks’ concerns about the reliability of corporate borrowers, have undermined the ability of the Federal Reserve to spark economic recovery by increasing the money supply. Aggressive monetary policy has done little to promote increased investment as banks have stockpiled cash, hoarding almost $2 trillion in “excess reserves”—money they have deposited at the Fed over and above what is required by law. This is unprecedented; the only other time in the last 50 years when excess reserves were more than $10 billion was after the September 11, 2001, attacks. (Note: $2 trillion is equal to $2,000 billion.)
Average household wealth has recovered, but consumer spending has not. The recovery from the 2001 recession was fueled by consumer spending—based on increasing debt and rising asset values. On the eve of the Great Recession, household debt payments were an unprecedented 18% of disposable personal income. As the crisis hit, household net worth plunged by over $13 trillion, led by falling home prices, and consumer spending fell accordingly. Since the recession, households have increased saving to bring down their debt levels. While this is good for individual balance sheets, it has meant reduced spending, lowering economy-wide demand and income. Average household wealth has since recovered, but the effect on consumer spending has been muted because most of the recovery has been in stocks, assets which are owned primarily by a small (and rich) portion of the U.S. population.
Fiscal policy has been contractionary. As in past recessions, the federal government responded to higher levels of unemployment through deficit spending. Large increases in deficit spending in 2008 and 2009 helped to halt the economic collapse at the beginning of the Great Recession. From there, however, the all-government deficit (including state and local governments, which traditionally run surpluses) swung heavily toward surplus. Despite persistently high levels of unemployment, government fiscal policy has been contractionary every year since 2010, with rising surpluses slowing an already anemic economic recovery.
Did you find this article useful? Please consider supporting our work by donating or subscribing.