By Gerald Friedman
Find a pdf version of this statement here.
A distinguished professor and Chair of the Department of Health Policy & Management, in the Rollins School of Public Health of Emory University, Kenneth Thorpe has been one of the leading figures in the analysis of health care finance in the United States. From 1993-95, he was Deputy Assistant Secretary for Health Policy in the U.S. Department of Health and Human Services in charge of coordinating financial estimates and program impacts of President Clinton’s health care reform proposal. Since leaving the Clinton White House, he has written widely about the economic advantages of a single payer system to finance health care. (See footnote 1.)
Thorpe’s expertise and reputation have added weight and authority to his attack on Senator Sanders’ program for Medicare-for-All. (See footnote 2.) This makes it all the more important that his analysis receive the type of scrutiny due a serious policy proposal. Unfortunately, Kenneth Thorpe does not provide enough documentation to make an explicit comparison between his estimates and those provided in detail by the Sanders campaign. He lists his projected Federal spending per year, he fails to explain how he calculated these numbers. While this failure makes it impossible to consider his claims on a point by point basis, it is possible to extract enough from his statement to conclude that his analysis is so deeply flawed that it implies some clearly unrealistic assumptions.
Subject to the caveat that Professor Thorpe fails to provide adequate documentation, there are several clear differences between the approach he follows and that followed by the Sanders campaign (summarized in Table 1 below):
- Thorpe assumes much fewer administrative savings. He assumes savings of 4.7% of national health expenditures from reduced administrative waste while Sanders has assumed 13% including saving 6% of total national health expenditures from reducing administrative expense in the private insurance industry (and in administering Medicaid) and savings of 7% from reducing administrative expenses in provider offices. Thus, Thorpe’s total savings projection is less than the savings that would be captured simply by eliminating the excess administrative overhead of the private insurance industry without considering the vast savings in provider offices. The savings from national single-payer are well documented. (See footnote 3.) For his part, Thorpe refers to a study done for Vermont when that state was considering a not-single-payer plan in a single state. The difference between the Thorpe assumption and Sanders is almost $400 billion a year, over a third of what Thorpe claims to be the excess costs of the Sanders plan.
- Thorpe accepts the Sanders assumption of maintenance of effort for existing public health care programs. While he does not specify, it may be that he rejects the Sanders assumption that MOE will include an increase with increasing national health care spending. In this case, he would be assuming an extra $100 billion/year in spending for the Sanders plan.
- Thorpe appears to assume an actuarial rate of 100% for the Sanders plan. Instead, it is assumed for the Sanders plan that some health care spending will be deemed optional, including some cosmetic surgery and over-the-counter medications. (See footnote 4.) The difference between the Sanders assumption of an actuarial rate of 98% and 100% is $96 billion/year.
- Thorpe assumes a “blended payment rate” at 105% of the Medicare rate. By contrast, the Sanders plan has factored in an increase in Medicaid rates to the Medicare level while assuming that reductions in administrative expenses would allow rates for what-is-now private-insurance provider payments to be lowered to that level as well. Because Thorpe does not include these administrative savings, his plan involves a real reduction in physician and hospital reimbursements of $68 billion a year below the Sanders spending rate.
- Thorpe makes no assumption about reduction in pharmaceutical prices. Sanders assumes a reduction in pharmaceutical prices would be negotiated to world levels, saving over $200 billion a year, over 3% of total spending.
- Thorpe assumes a reduction in the rate of health care inflation, but does not specify a number. This is a crucial issue because in the long run the largest savings will come from bending the cost curve. The Sanders plan assumes 1.1% a year, producing savings of over $200 billion/year for the first decade of the program, 2017-26. It is unclear what savings Thorpe anticipates from bending the cost curve with a single-payer program. In six of the ten years, Thorpe’s estimates imply inflation rates lower than the CMS projections, but in three he seems to imply higher inflation rates.
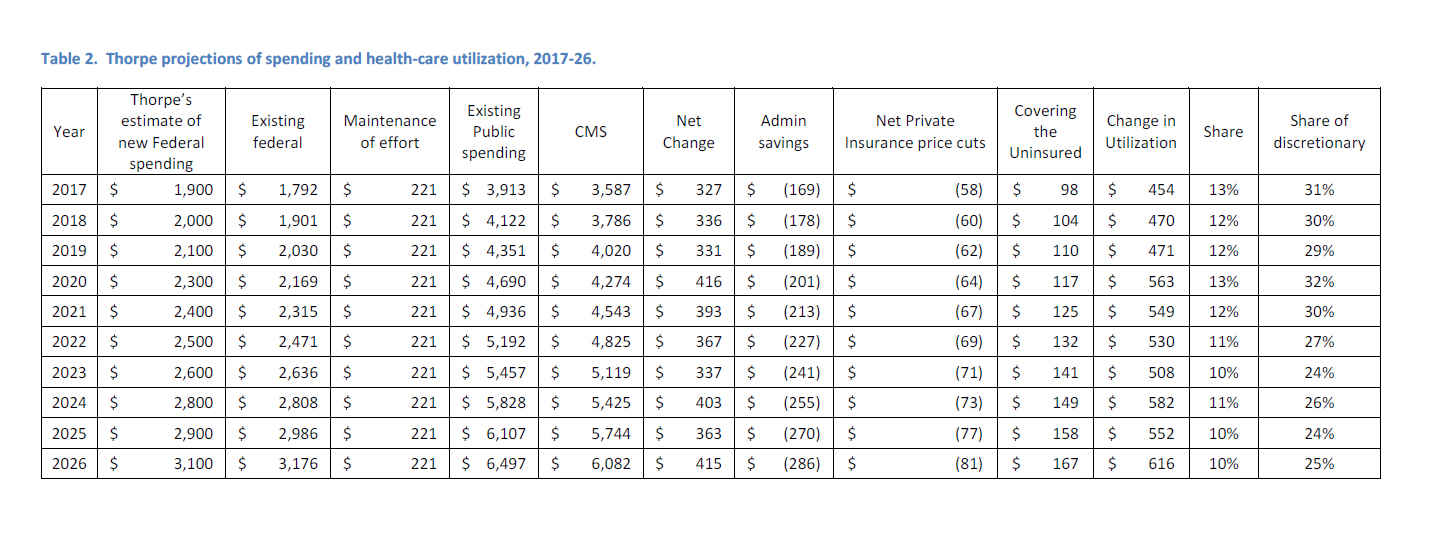
Beginning with Thorpe’s projection of needed additional Federal spending (his Table 1--see footnote 5 ), I have constructed Thorpe’s projected National Health Expenditures by adding projected Federal and other non-Medicaid public spending and an assumption that Maintenance of Effort for state and local Medicaid will be at the 2016 level (see my Table 2 below). It appears that Thorpe is assuming an increase in spending of $3.7 trillion over 10 years compared with CMS estimates of national health expenditures 2017-26. While this reflects his estimate of the increase in spending due to increased utilization of health services, he is assuming an even larger increase because he also accepts that administrative costs will fall by 4.7% and he assumes a reduction in rates for what-is-now private insurance. Taking these into account (see my Table 2), he is assuming increases in spending over the CMS projections of $6.6 trillion. Presumably, these are due to increases in utilization from the extension of coverage to the entire population, including the 30 million currently uninsured, and the removal of copayments and deductibles. (See footnote 6.)
After factoring out the cost of extending coverage, the utilization increase that Thorpe is assuming is 14% of currently projected spending 2017-26. (See footnote 7.) Much current spending, however, is unaffected by changes in copayments and deductibles. Medicaid, for example, does not charge these. Spending on investment and administrative tasks are also largely unaffected; and hospitalization is generally decided by physicians without regard to individual patient’s cost sharing. (See footnote 8.) After removing nondiscretionary spending, Thorpe is assuming an increase in discretionary spending of 38% a year.
Thorpe is assuming an implausibly large increase in utilization with the elimination of copayments and deductibles, and this assumption accounts for 60% of his assumed increase in spending required for the Sanders plan. Furthermore, note that the Sanders plan already assumes an overall increase in utilization of health care services of 6%, an increase of 15% in services subject to any choice.
What then remains of Kenneth Thorpe’s critique of the Sanders plan? Hidden numbers and implausible assumptions are hardly the stuff of serious policy discussion. But that may not have been the intent of a memo written by a scholar who knows that a single-payer program would be cheaper and more efficient than the current health care system; a scholar who surely knows that what he wrote is misleading.
(Footnote 1) See, for examples, See Thorpe’s analysis at http://masscare.org/wp-content/uploads/2012/11/Thorpe_Action_Dec14.pdf. Also see his national analysis at http://www.pnhp.org/sites/default/files/Thorpe%20booklet.pdf.
(Footnote 2) The Thorpe study was cited by Hillary Clinton in her debate with Senator Sanders on Feb 4, 2016. Also see Dylan Matthews, “Study: Bernie Sanders’s Single-Payer Plan Is Almost Twice as Expensive as He Says,” Vox, January 28, 2016, http://www.vox.com/2016/1/28/10858644/bernie-sanders-kenneth-thorpe-single-payer; Dylan Matthews, “Kenneth Thorpe’s Analysis of Bernie Sanders’s Single-Payer Proposal.,” Scribd, accessed February 5, 2016, https://www.scribd.com/doc/296831690/Kenneth-Thorpe-s-analysis-of-Bernie-Sanders-s-single-payer-proposal; Paul Starr, “The False Lure of the Sanders Single-Payer Plan,” The American Prospect, February 1, 2016, http://prospect.org/article/false-lure-sanders-single-payer-plan; Committee for a Responsible Federal Budget, “Does the Sanders Single-Payer Plan Add Up?,” Committee for a Responsible Federal Budget, accessed February 5, 2016, http://crfb.org/blogs/does-sanders-single-payer-plan-add.
(Footnote 3) Thorpe himself anticipated much larger savings in his 2005 studies for Massachusetts (over 20%), and for the entire United States. These are much larger than the savings anticipated in the Sanders plan. David Himmelstein, “What One Critic Gets Wrong About The Sanders Health Care Plan,” The Huffington Post, accessed February 1, 2016, http://www.huffingtonpost.com/david-himmelstein/kenneth-thorpe-bernie-sanders-single-payer_b_9113192.html; David Himmelstein, Steffie Woolhandler, and Sidney Wolfe, “Administrative Waste in the U.S. Health Care System in 2003: The Cost to the Nation, the States, and the District of Columbia, with State-Specific Estimates of Potential Savings,” International Journal of Health Services 34, no. 1 (2004): 79–86; David U. Himmelstein et al., “A Comparison Of Hospital Administrative Costs In Eight Nations: US Costs Exceed All Others By Far,” Health Affairs 33, no. 9 (September 1, 2014): 1586–94, doi:10.1377/hlthaff.2013.1327.
(Footnote 4) The Sanders plan would not include some cosmetic surgery and dental procedures, some optional treatments, and over-the-counter medications. National health expenditures include over $40 billion for over-the-counter medications, or over 1% of total expenditures; also see http://www.chpa.org/marketstats.aspx.
(Footnote 5) Matthews, “Kenneth Thorpe’s Analysis of Bernie Sanders’s Single-Payer Proposal.” https://www.scribd.com/doc/296831690/Kenneth-Thorpe-s-analysis-of-Bernie-Sanders-s-single-payer-proposal
(Footnote 6) Ibid (https://www.scribd.com/doc/296831690/Kenneth-Thorpe-s-analysis-of-Bernie-Sanders-s-single-payer-proposal). This is emphasized in Starr, “The False Lure of the Sanders Single-Payer Plan.”
(Footnote 7) have assumed that the uninsured currently spend 55% as much as the national average on health care, and they will spend 85% as much when insured. (I expect that the lower spending because of their age distribution; the uninsured are younger and less likely to be disabled than the insured because the insured include the Medicare population.) Jack Hadley and John Holahan, “The Cost of Care for the Uninsured: What Do We Spend, Who Pays, and What Would Full Coverage Add to Medical Spending” (Kaiser Commission on Medicaid and the Uninsured, May 10, 2004), http://www.kff.org/uninsured/upload/The-Cost-of-Care-for-the-Uninsured-What-Do-We-Spend-Who-Pays-and-What-Would-Full-Coverage-Add-to-Medical-Spending.pdf.
(Footnote 8) Some insurance plans have no deductibles or copayments, and some individuals have multiple plans so that they have first-dollar coverage. People with such policies would also be unaffected by the elimination of copayments and deductibles in the Sanders program.
Table 1. Differences between Thorpe and Sanders projected annual spending for Medicare-for-All program, 2017-26.
| Annual differences | |
| Administrative | $ 384 |
| Drug prices | $ 211 |
| Actuarial rate | $ 95 |
| Maintenance of effort? | $ 100 |
| Utilization? | $ 660 |
| Private insurance rate reduction | $ (68) |